Sleep analysis in R language
Sleep and breastfeeding study of my daughter aged 2-16 months.
The data is collected throught the Glow app where the father and I input data manually.
We started documenting data when our daughter was a little over a month old, as we navigated the
uncertainties of standard newborn behaviors. Being deeply engaged with her often made it difficult
to monitor time, and admittedly, the postpartum memory isn't exactly renowned for its reliability.
Reviewing the recorded data helped us determine if her fussiness stemmed from lack of sleep or
hunger, or if there might be another underlying issue.
Here are the links to the
dataset
and for the R-language code
in Kaggle.
Sleep analysis
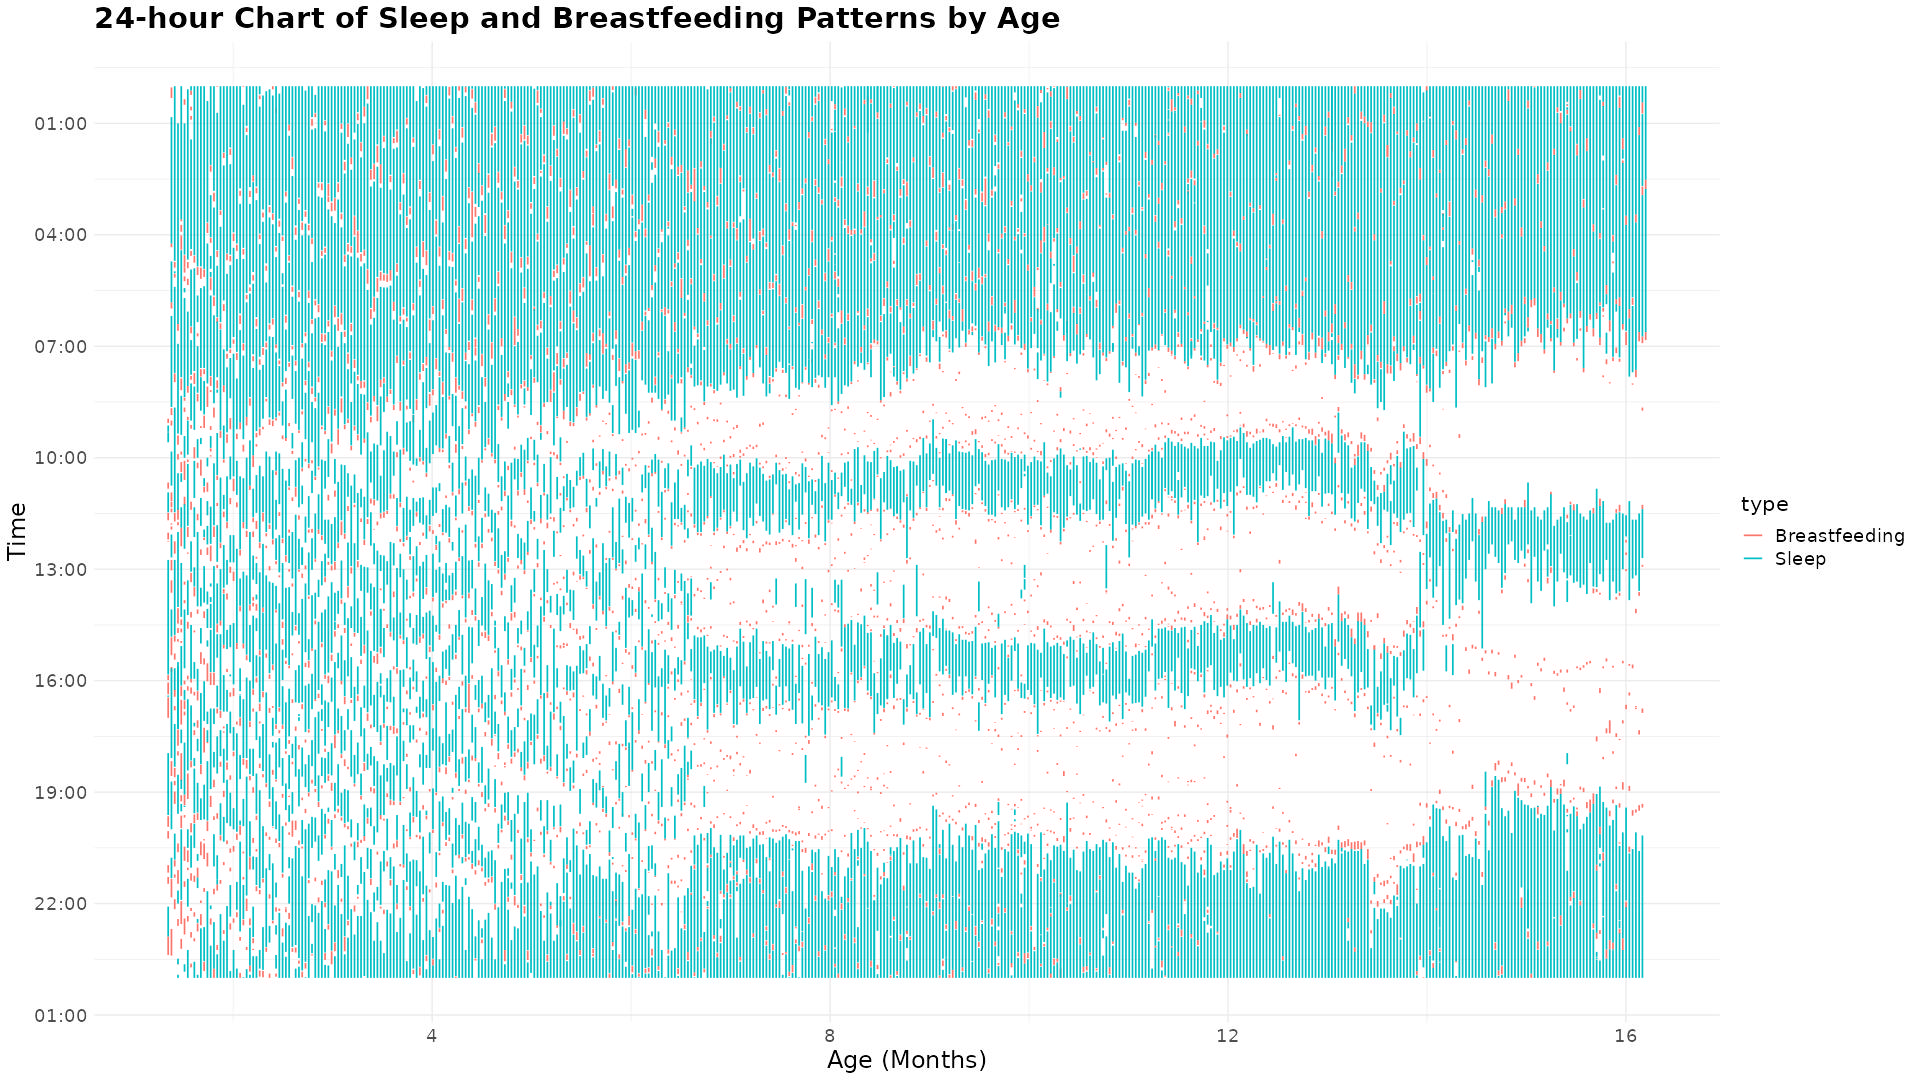
A summarized tile chart displays her daily sleep and breastfeeding patterns, spanning from 12 AM to 12 AM the following day.:
Here is the annotated version of the 24-hour chart:
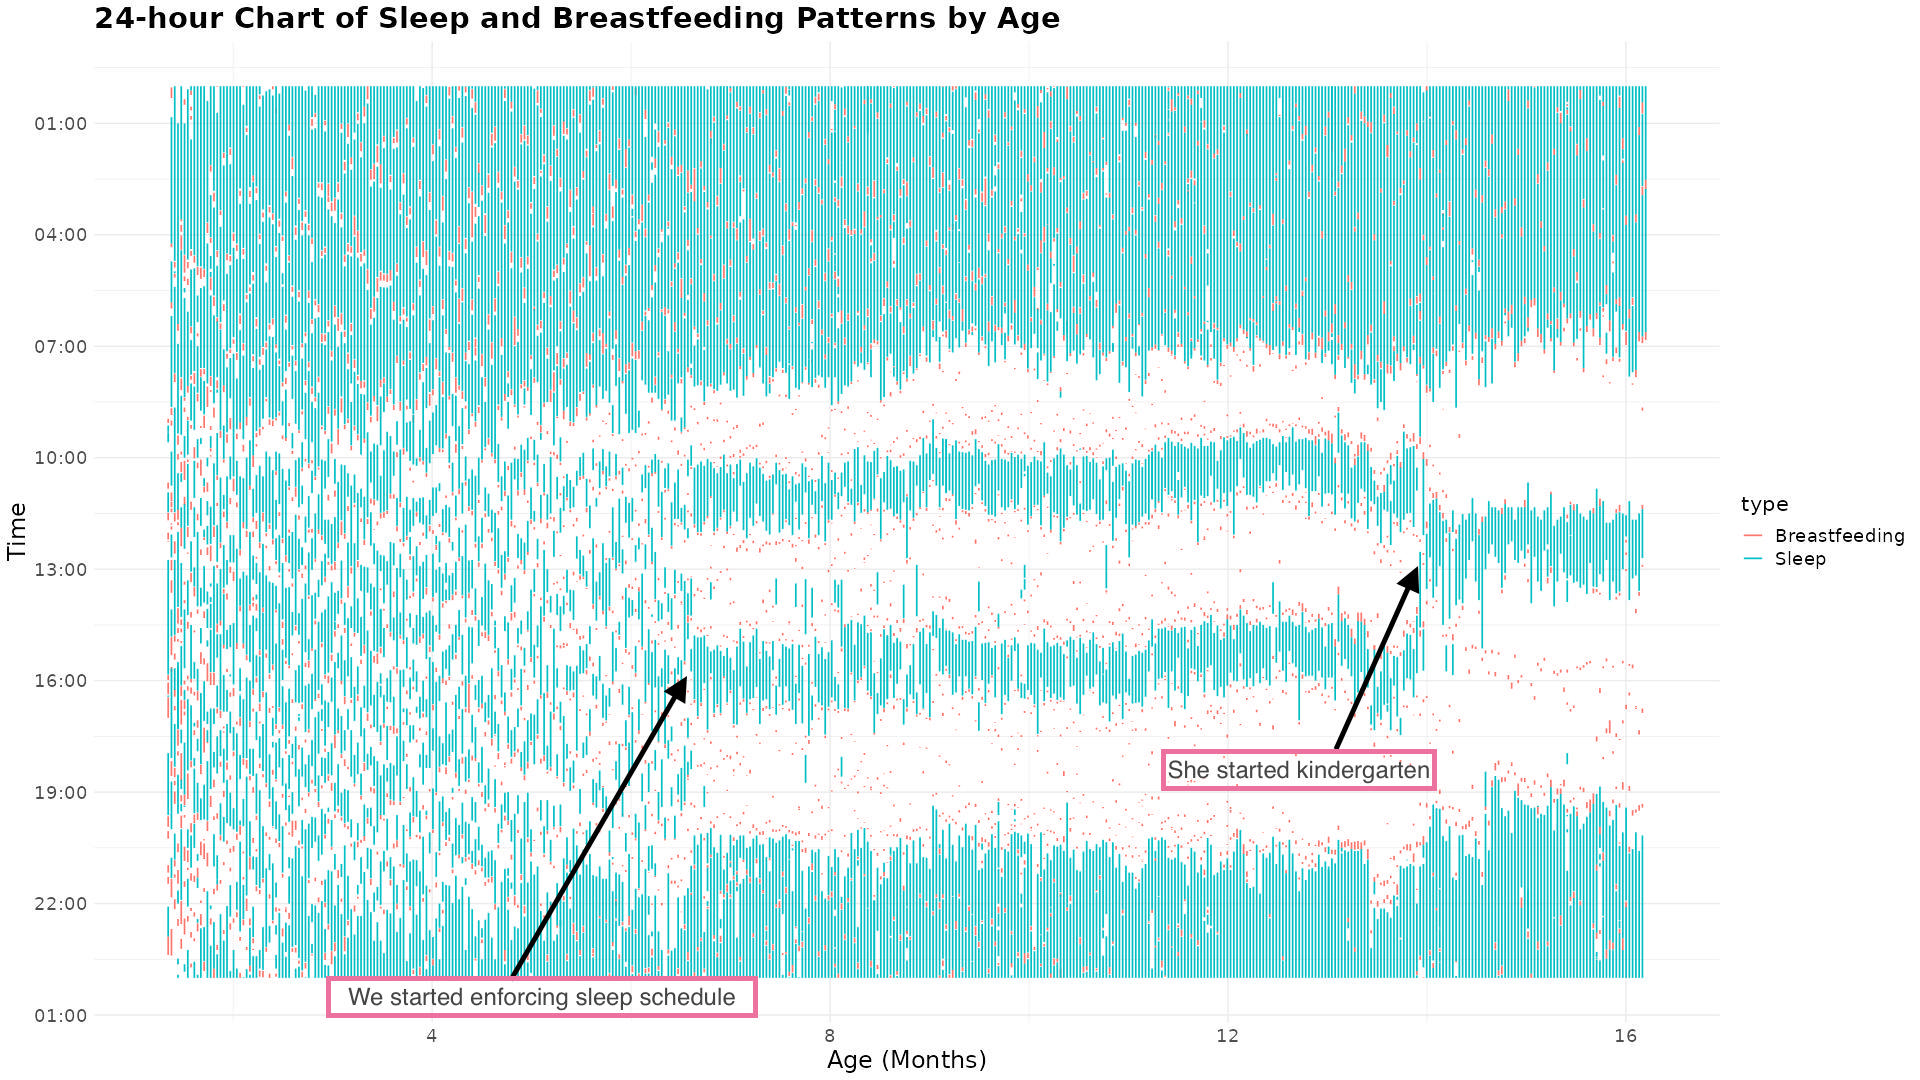
We began implementing a sleep schedule when she was 6.5 months old. By extending her wake periods,
she seamlessly adapted to the new routine from day one. Initially, we aimed for a three-nap
schedule, but her naps were so extended that fitting in a third nap became impossible.
At 14 months, she started kindergarten, necessitating a shift to a one-nap routine. This adjustment
proved challenging as she wasn't accustomed to longer wakeful periods, leading to some cranky
evenings. However, after about two weeks, she settled comfortably into the new routine.
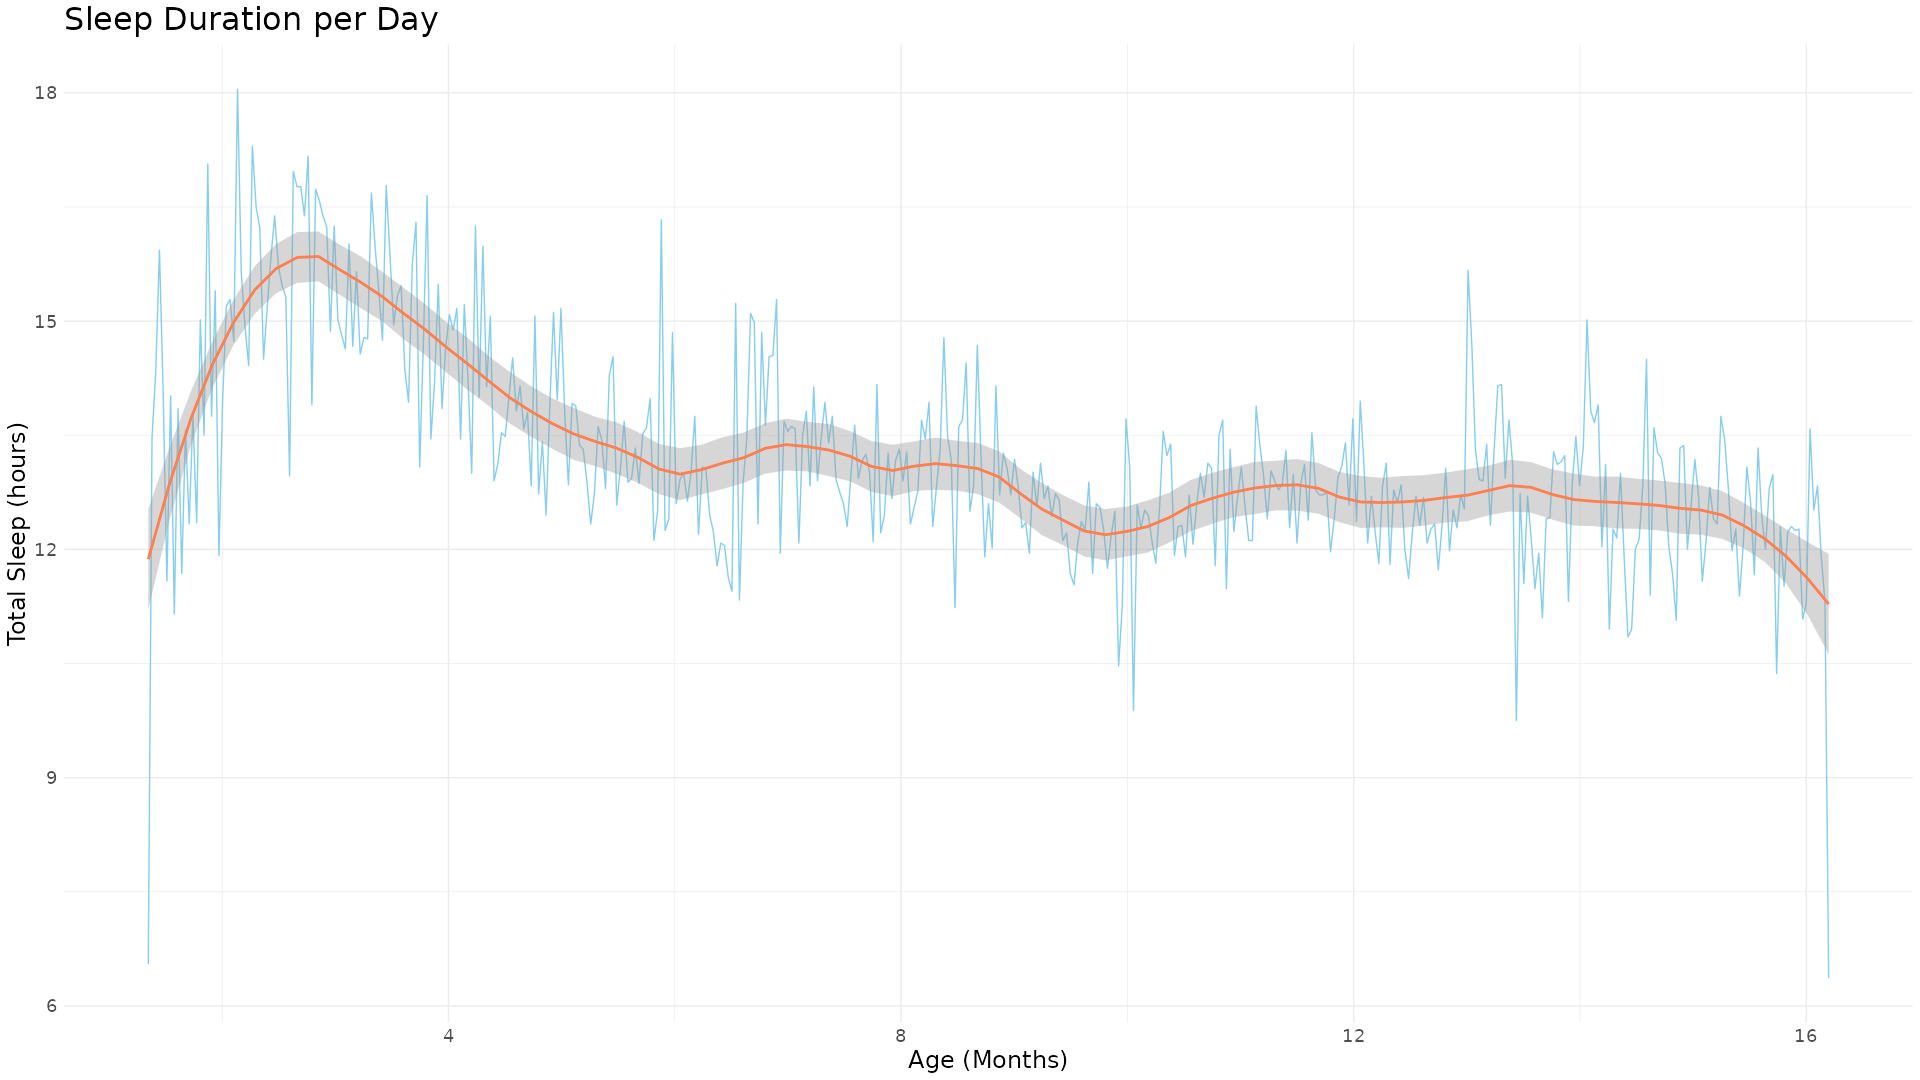
From the sleep duration graph, we can see a rise in her daily sleep duration until the third month,
likely a result of her mastering nap linking. The introduction of a sleep schedule at 6.5 months
appears to have had a marginally positive impact on her sleep length. Post the 14-month mark, the
graph displays increased fluctuations, possibly due to her daytime naps at the kindergarten. There,
she naps outdoors in a stroller, exposing her to more potential disturbances. Conversely, at home
during weekends, she enjoys an optimal nap environment in her bed, with blackout curtains and white
noise ensuring a superior nap experience.
Overall, she seems to have slept soundly, with only brief night-time awakenings for breastfeeding.
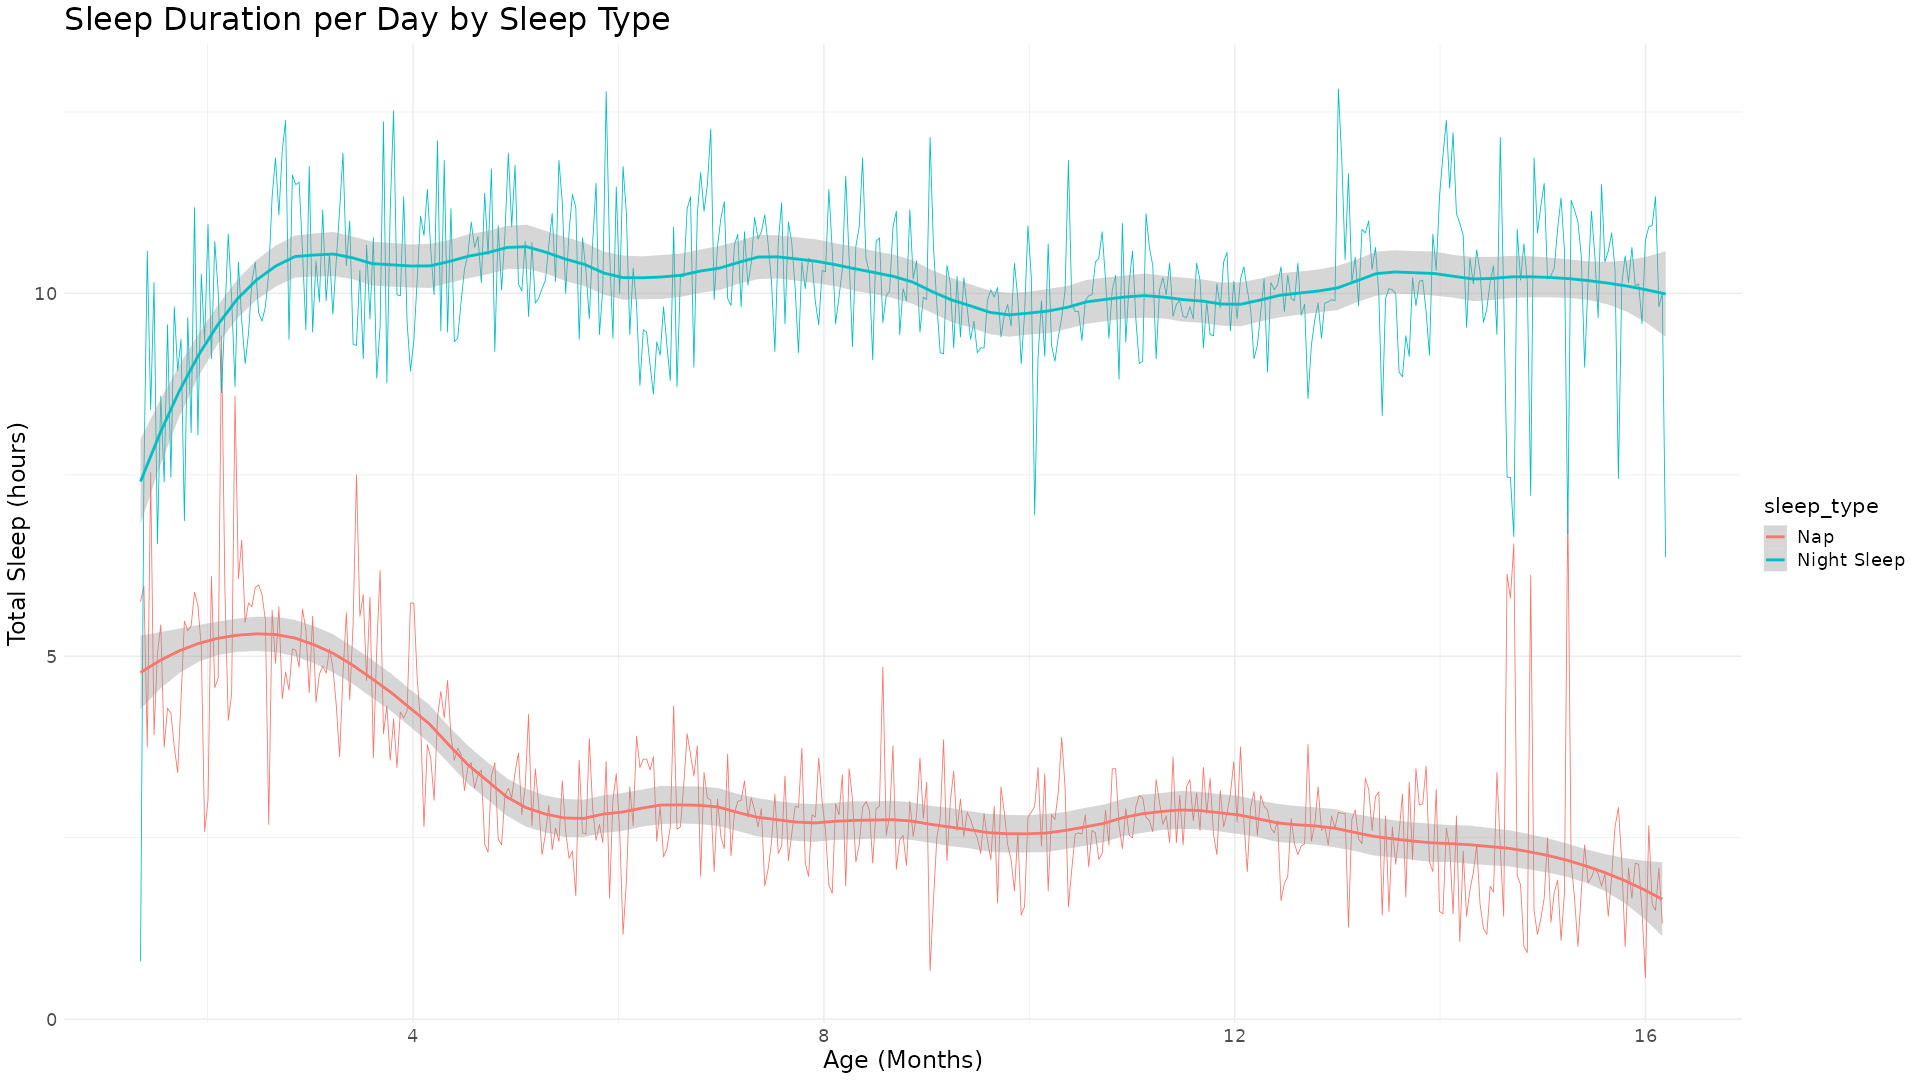
In the 'Sleep Duration by Sleep Type' chart, I've categorized her sleep into 'Night Sleep' and 'Naps'. It's evident that her night sleep stabilized from the third month onward, while her nap durations saw a significant decline from the third month, leveling off from the fifth month. However, upon starting kindergarten, her nap durations began to decrease once more.
Breastfeeding analysis
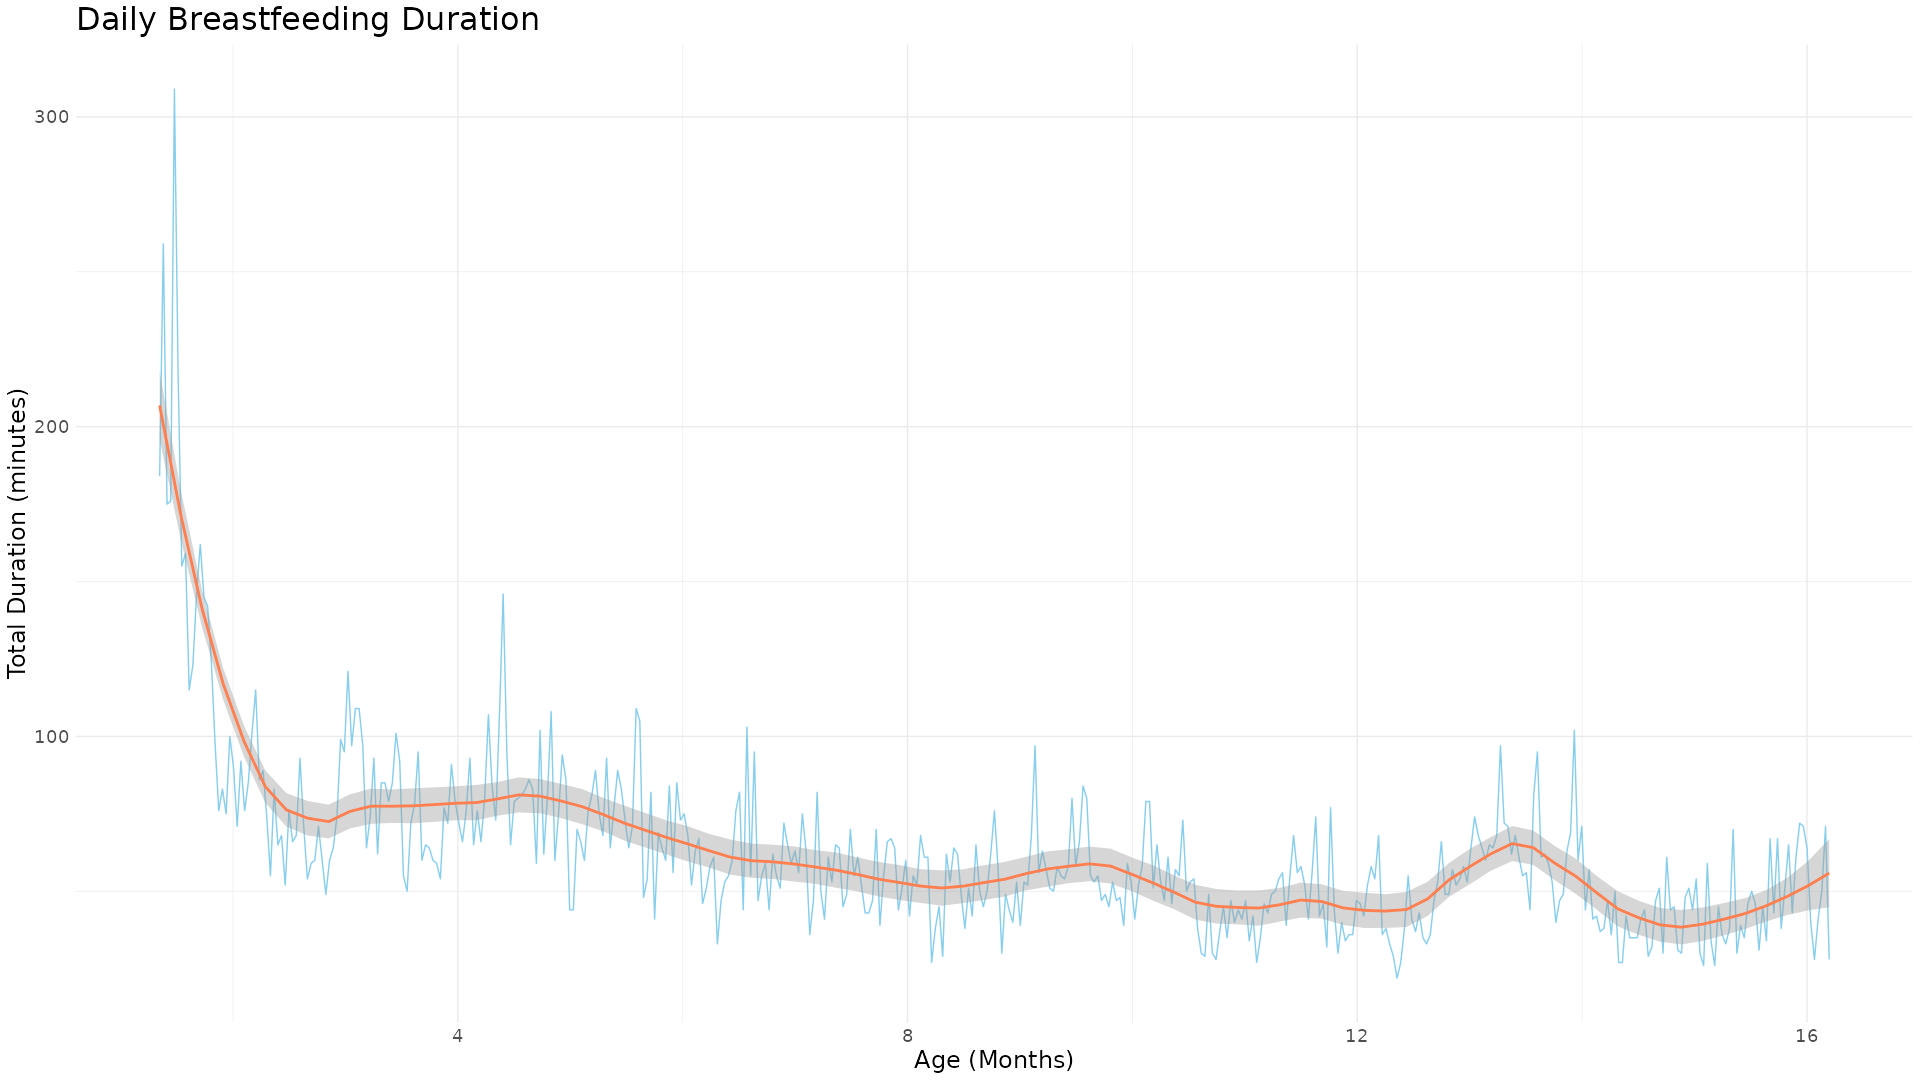
From the 24-hour chart, her breastfeeding appears somewhat sporadic. However, a discernible pattern emerges, with feedings often occurring just before and after naps. Since she began kindergarten, she hasn't been breastfeeding during those hours, but the pattern persists during weekends. Interestingly, the duration of breastfeeding hasn't decreased with her start at kindergarten. In fact, there are indications of an uptick. This could perhaps be attributed to her seeking more comfort and closeness after spending time in the kindergarten environment.
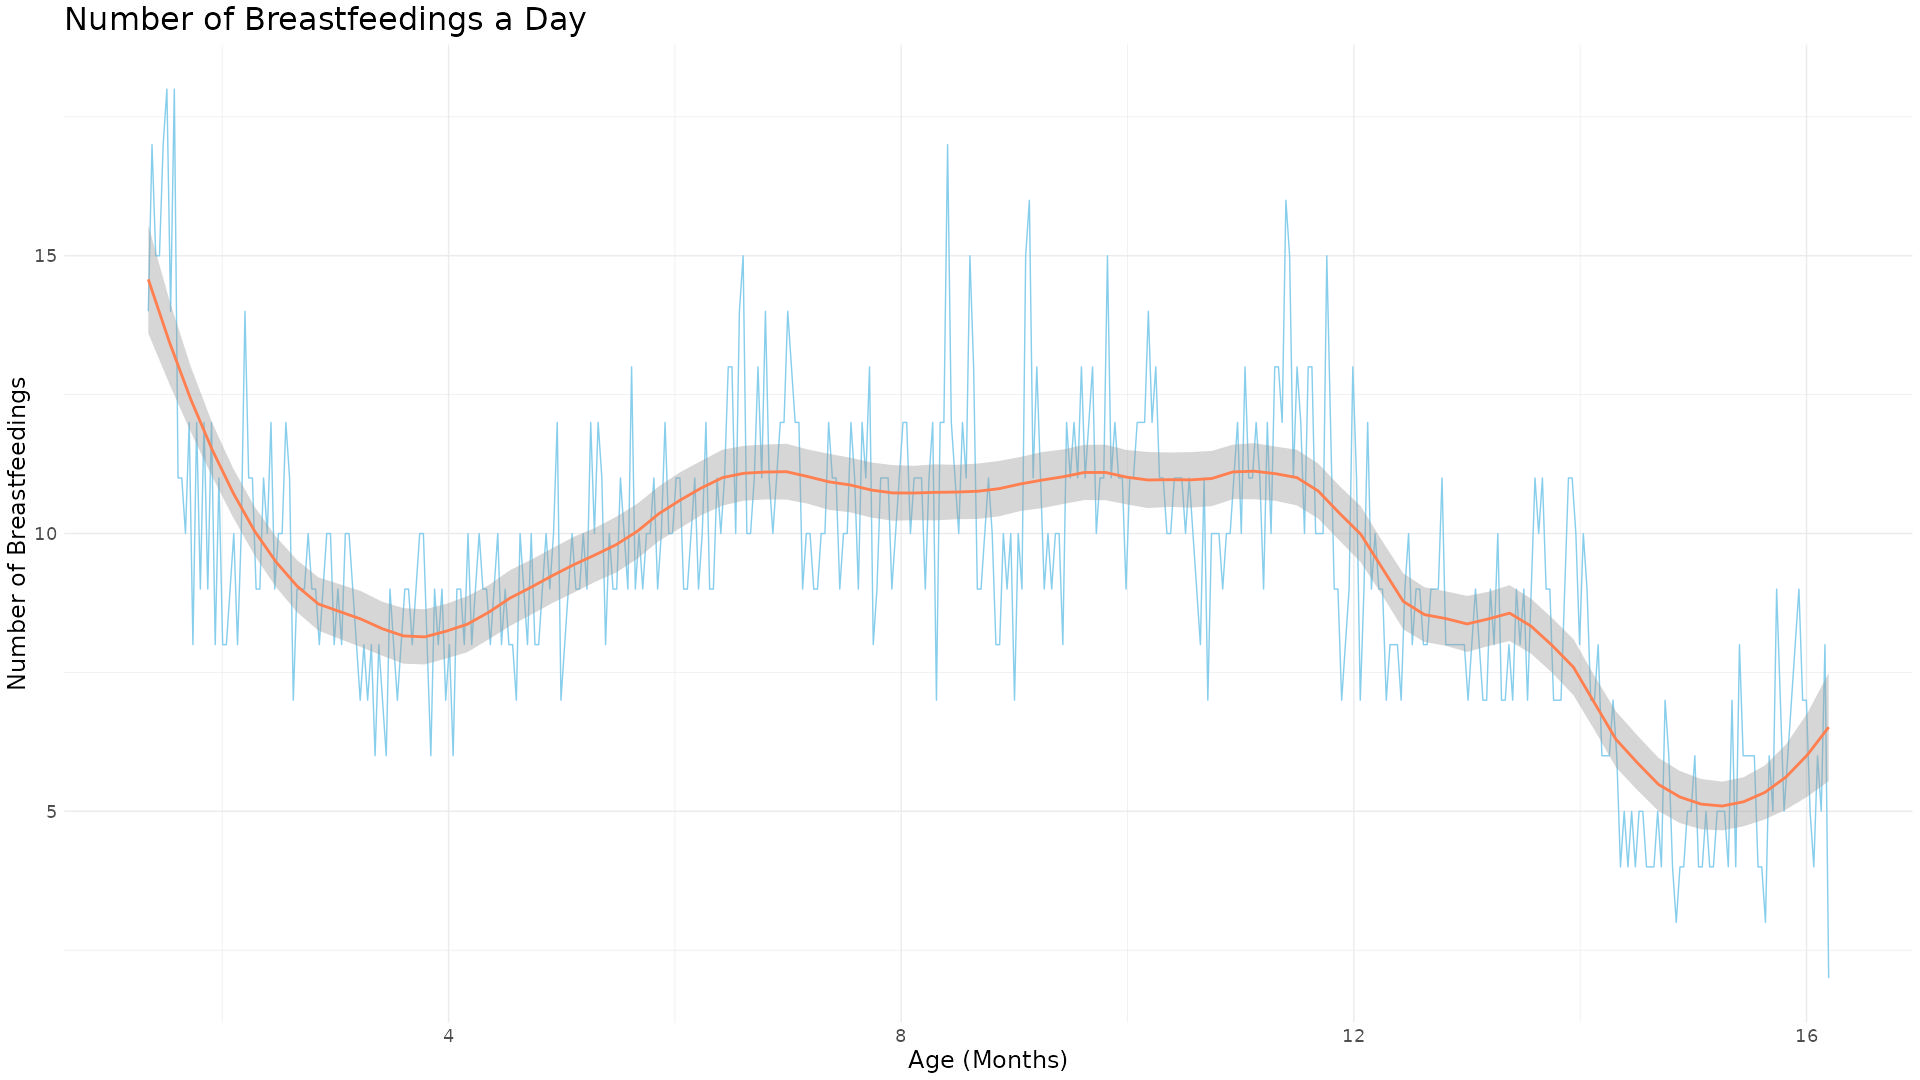
Interestingly, while the duration of breastfeeding has remained relatively consistent, the frequency of breastfeeding sessions has seen more fluctuations. A noticeable increase is evident in the recent months. This could be attributed to her time in kindergarten. However, another contributing factor could be the 15-month vaccine, to which she had a reaction, manifesting as a fever, development of a rash, and increased fussiness.
Overall, delving into this dataset was both enlightening and a valuable exercise in R programming. It provided insights into her sleep and breastfeeding patterns.